Canary Deployment in Kubernetes: 5%, 10%, 25%, 50% to 100% Traffic
Why I use canary
A normal deployment asks:
is the new version healthy?
Canary asks a better question:
is the new version healthy under real production traffic compared with the stable version?
I use canary for higher-risk application changes where a small production sample provides valuable evidence.
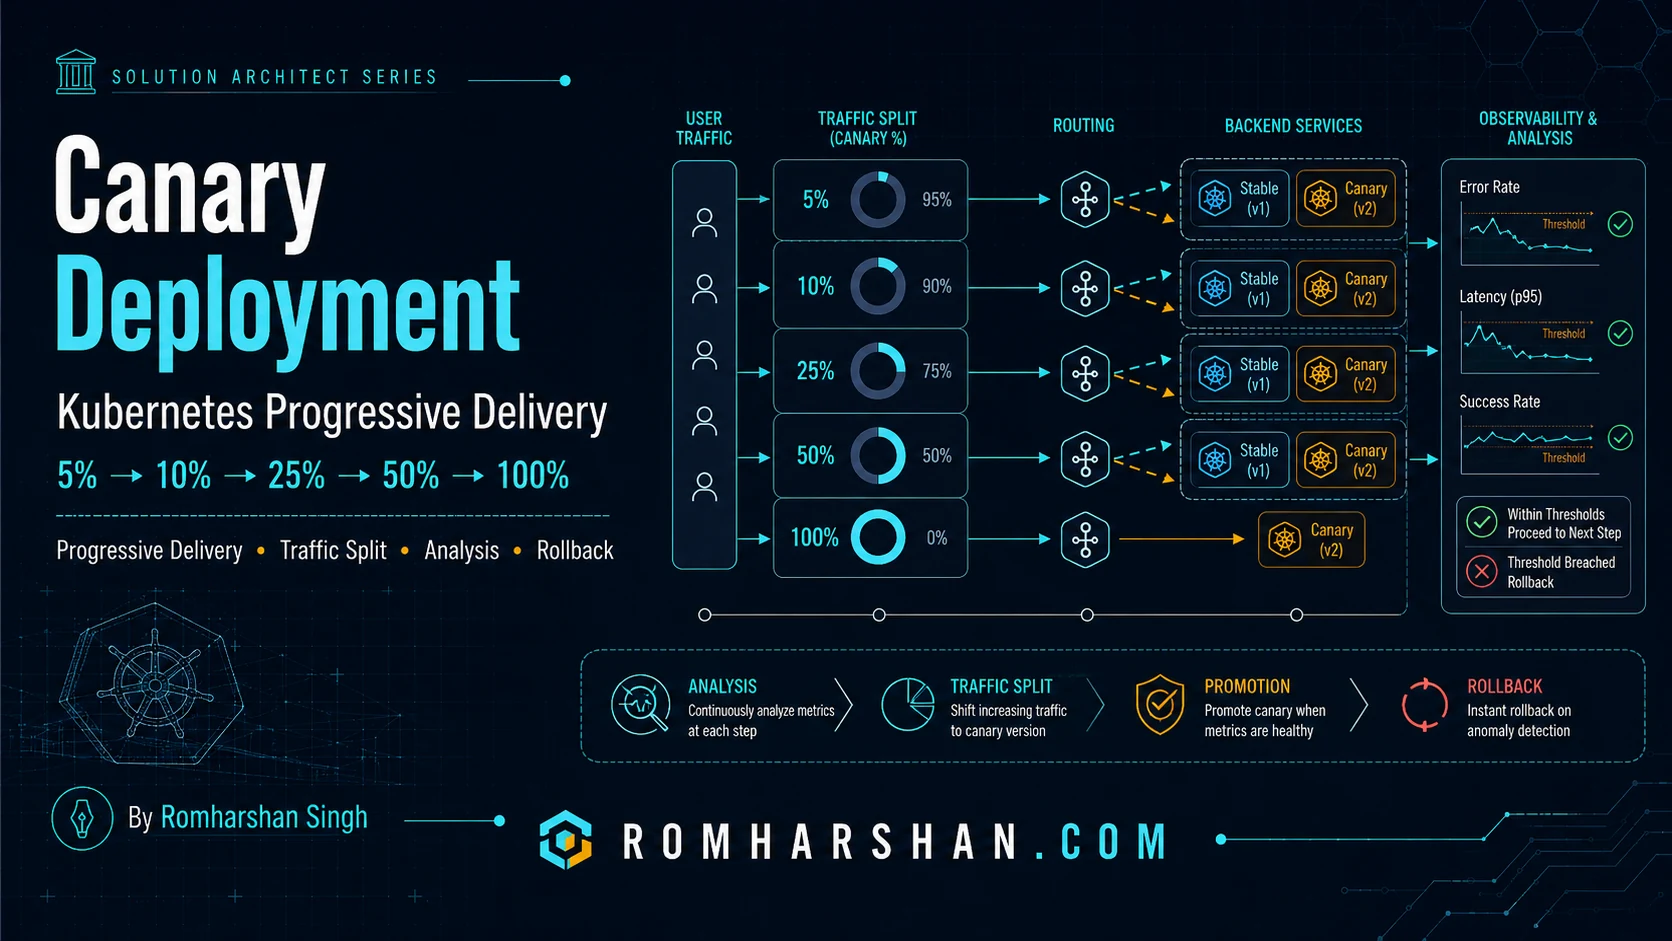
My conceptual progression:
5%
10%
25%
50%
100%
The exact percentages are not sacred. The point is to increase exposure only after metrics remain healthy.
Traffic stages
Example release:
09:00 -> 5%   for 10 min
09:10 -> 10%  for 10 min
09:20 -> 25%  for 15 min
09:35 -> 50%  for 20 min
09:55 -> 100%
At each gate I compare:
HTTP error rate
p95 / p99 latency
CPU/memory
DB errors
dependency errors
business conversion/success
custom critical workflow metric
Argo Rollouts example
apiVersion: argoproj.io/v1alpha1
kind: Rollout
metadata:
  name: booking-service
spec:
  replicas: 10
  strategy:
    canary:
      stableService: booking-stable
      canaryService: booking-canary
      trafficRouting:
        istio:
          virtualService:
            name: booking-vsvc
            routes:
              - primary
      steps:
        - setWeight: 5
        - pause:
            duration: 10m

        - setWeight: 10
        - pause:
            duration: 10m

        - setWeight: 25
        - pause:
            duration: 15m

        - setWeight: 50
        - pause:
            duration: 20m

        - setWeight: 100
This defines traffic progression, not approval logic by itself.
Metric analysis gate
Argo AnalysisTemplate style:
apiVersion: argoproj.io/v1alpha1
kind: AnalysisTemplate
metadata:
  name: booking-success-rate
spec:
  metrics:
    - name: success-rate
      interval: 2m
      successCondition: result[0] >= 99.5
      failureLimit: 2
      provider:
        prometheus:
          address: http://prometheus.monitoring:9090
          query: |
            sum(
              rate(
                http_requests_total{
                  app="booking",
                  version="canary",
                  status!~"5.."
                }[5m]
              )
            )
            /
            sum(
              rate(
                http_requests_total{
                  app="booking",
                  version="canary"
                }[5m]
              )
            )
            * 100
I also compare canary to stable. A 99% success rate may look good until stable is 99.99%.
Business metric
Technical metrics are not enough.
A booking release can return HTTP 200 while failing to complete supplier confirmation.
I add business metrics:
booking_confirmed / booking_attempted
payment_capture_success
bid_submission_success
product_sync_success
Cohort canary
Percentage routing is not the only approach.
I often prefer:
internal employees
specific tenant
specific geography
selected partner
before anonymous percentage traffic.
This reduces risk and makes validation easier.
Sticky routing
If one user alternates between stable and canary across a multi-step flow, behavior can be confusing.
For stateful workflows I use sticky routing by:
user id
session
tenant
header
cookie
depending on gateway/mesh capabilities.
Database compatibility
Stable and canary coexist.
The same expand-contract rules apply.
The canary must not write data stable cannot read.
Automatic abort
If:
canary 5xx > threshold
p95 > stable * 1.25
business success < threshold
the rollout should abort.
kubectl argo rollouts abort \
  booking-service
Then traffic returns to stable.
What 5% actually means
If traffic is only 20 requests/minute, 5% gives one request/minute—not statistically meaningful.
For low-volume systems I use:
- longer observation;
- selected cohorts;
- synthetic transactions;
- manual approval;
- larger initial percentage.
Progressive delivery is about evidence, not blindly following percentages.
Production checklist
- Stable and canary versions observable separately.
- Explicit 5/10/25/50/100 stages or justified alternative.
- Metric gates.
- Business metric.
- Abort automation.
- Sticky routing if workflow requires it.
- Backward-compatible DB/API.
- Enough sample volume.
- Rollout owner watching release.
- Clear promotion/abort command.
FAQ
Why start at 5%?
It limits blast radius while collecting real traffic. For low-volume systems, a cohort may be better.
Canary vs A/B test?
Canary validates release safety. A/B tests intentionally compare product behavior or conversion.
Can Kubernetes Deployment alone split exact traffic percentages?
Replica counts approximate traffic but do not guarantee exact percentages. Service mesh, ingress/gateway weighted routing or Argo Rollouts integration gives better control.
Related architecture guides
- [Production Deployment Patterns I Have Used](/articles/production-deployment-patterns-blue-green-canary-rolling)
- [Blue-Green Deployment](/articles/blue-green-deployment-kubernetes-nginx-production)
-
Zero-Downtime Database Changes
Architect's final take
I use canary when production traffic itself is part of the test. The release moves forward only when both technical and business signals stay inside the agreed envelope.
Your feedback helps prioritize deeper technical content.

Romharshan Singh
Senior Solution Architect and Full Stack Technology Leader with 20+ years of enterprise engineering experience across AI, cloud, distributed systems, Java, Node.js, React, Angular, Kafka and Kubernetes.