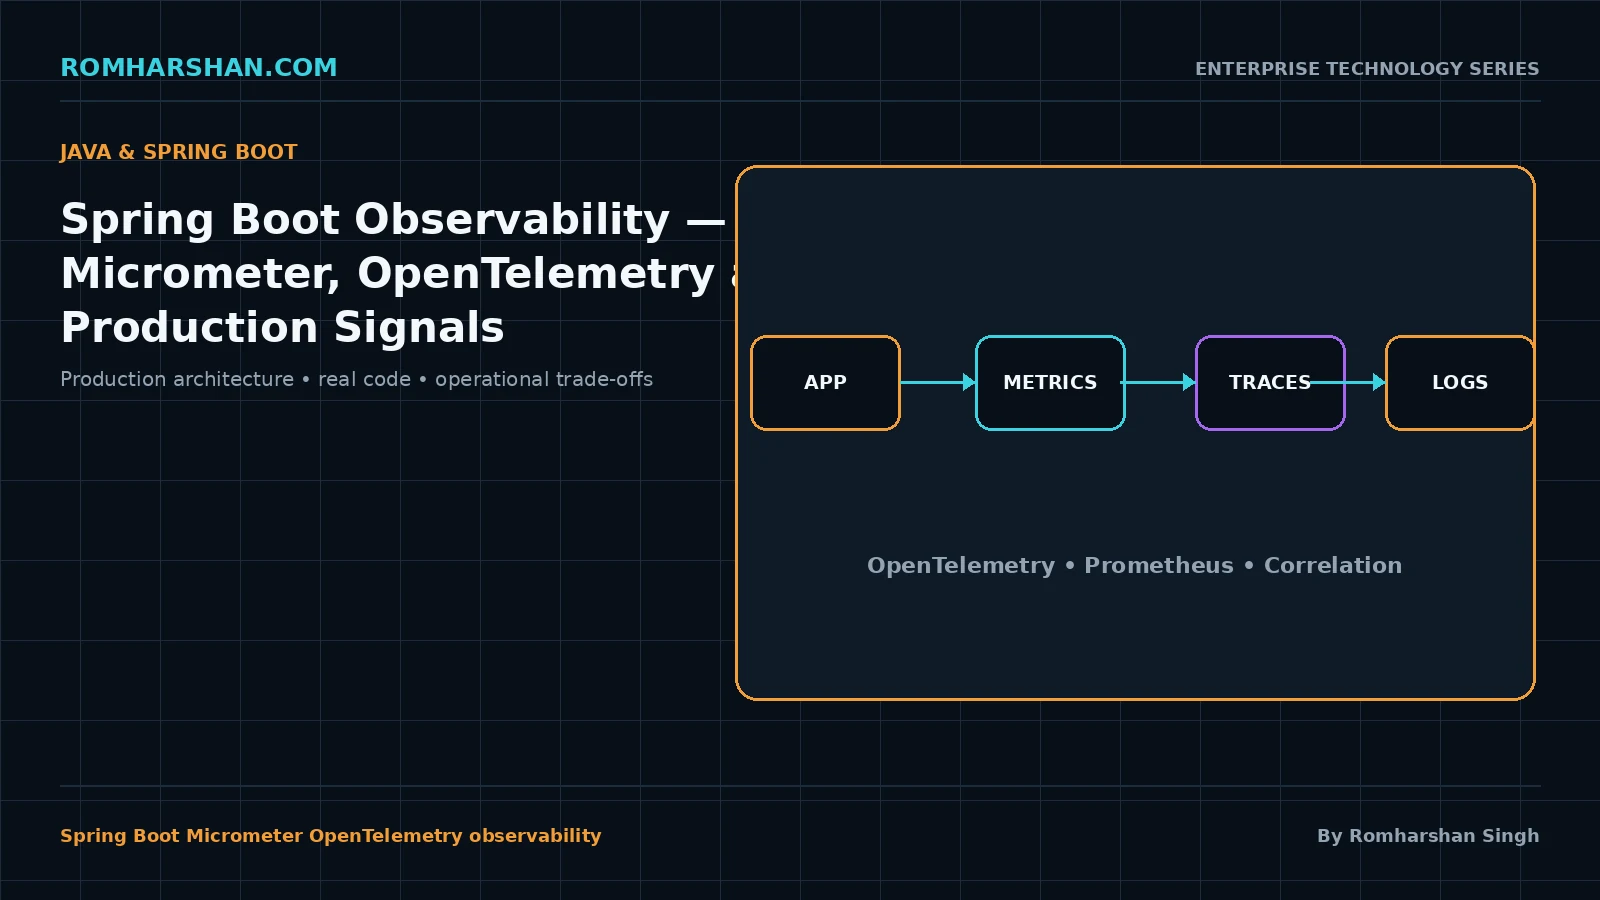
Spring Boot Observability: Micrometer, OpenTelemetry and Production Signals
A production observability model for Spring Boot covering service metrics, traces, logs, JVM signals and actionable alerting.
Why this matters in production
JVM graphs can be green while users experience timeouts. Service-level symptoms must lead the incident response, with JVM and pool metrics explaining the cause.
When I review this kind of design, I do not start with the framework feature. I start with the production behavior: who owns the data, what can fail independently, what work is synchronous, what work is asynchronous, what the latency budget is, and what evidence we will have when the design is under pressure. That approach keeps the technology useful without letting it become the architecture.
The decision model I use
1. Use Micrometer for consistent service metrics.
Use Micrometer for consistent service metrics. I use this as an architecture review question because it forces the team to make ownership and operational impact explicit. The goal is not theoretical purity; the goal is a design that remains understandable when traffic increases, dependencies slow down, and another engineer has to diagnose the system at 2 AM.
2. Propagate OpenTelemetry traces through HTTP and Kafka.
Propagate OpenTelemetry traces through HTTP and Kafka. I use this as an architecture review question because it forces the team to make ownership and operational impact explicit. The goal is not theoretical purity; the goal is a design that remains understandable when traffic increases, dependencies slow down, and another engineer has to diagnose the system at 2 AM.
3. Add structured trace IDs to logs.
Add structured trace IDs to logs. I use this as an architecture review question because it forces the team to make ownership and operational impact explicit. The goal is not theoretical purity; the goal is a design that remains understandable when traffic increases, dependencies slow down, and another engineer has to diagnose the system at 2 AM.
4. Bound metric cardinality.
Bound metric cardinality. I use this as an architecture review question because it forces the team to make ownership and operational impact explicit. The goal is not theoretical purity; the goal is a design that remains understandable when traffic increases, dependencies slow down, and another engineer has to diagnose the system at 2 AM.
5. Track JVM, GC, connection pools and thread pools as saturation signals.
Track JVM, GC, connection pools and thread pools as saturation signals. I use this as an architecture review question because it forces the team to make ownership and operational impact explicit. The goal is not theoretical purity; the goal is a design that remains understandable when traffic increases, dependencies slow down, and another engineer has to diagnose the system at 2 AM.
6. Alert on error and latency impact, not one transient infrastructure spike.
Alert on error and latency impact, not one transient infrastructure spike. I use this as an architecture review question because it forces the team to make ownership and operational impact explicit. The goal is not theoretical purity; the goal is a design that remains understandable when traffic increases, dependencies slow down, and another engineer has to diagnose the system at 2 AM.
Reference implementation
Timer timer = Timer.builder("pricing.client.latency")
    .tag("dependency", "pricing")
    .publishPercentileHistogram()
    .register(meterRegistry);

return timer.record(() -> pricingClient.quote(request));
The code is intentionally small. Production architecture should make the important boundary visible in a few lines. Framework configuration can grow, but the ownership rule should remain obvious.
Failure modes I design against
- Raw URLs as metric labels. This usually looks harmless during development, but in production it increases coupling, hides capacity limits, or makes recovery ambiguous.
- Unique customer IDs in Prometheus labels. This usually looks harmless during development, but in production it increases coupling, hides capacity limits, or makes recovery ambiguous.
- No correlation between logs and traces. This usually looks harmless during development, but in production it increases coupling, hides capacity limits, or makes recovery ambiguous.
- Only host-level alerts. This usually looks harmless during development, but in production it increases coupling, hides capacity limits, or makes recovery ambiguous.
These are the situations I want the team to discuss before load testing or an incident exposes them. A robust design does not assume dependencies remain fast, messages arrive once, users follow the happy path, or every deployment completes perfectly.
Testing strategy
I test at three levels. First, unit tests prove domain decisions and state transitions without the network. Second, integration tests prove the real adapter behavior against the database, broker, browser runtime or framework boundary. Third, a small set of end-to-end tests proves the critical user or business journey.
For failure handling, I deliberately test timeout, duplicate delivery, partial dependency failure, invalid data, cancellation and restart behavior where those cases apply. Happy-path coverage alone is not enough for architecture code.
Deployment and rollout
I prefer small, observable releases. The release should include a way to identify the new version in logs and metrics, a health/readiness signal, and a rollback or roll-forward decision. If the change affects a shared schema or contract, compatibility must exist while old and new versions overlap.
For high-impact changes I use progressive exposure rather than assuming that a successful build means a safe production release. The exact mechanism can be rolling, blue-green, canary or a feature flag; the principle is the same: limit blast radius while evidence is still being collected.
Observability I expect
At minimum I want request or message volume, error rate, latency, and saturation for the resource that constrains the design. Distributed boundaries should propagate correlation or trace context. Logs should be structured and should not rely on sensitive payloads to explain what happened.
The dashboard should answer a concrete question. “Is this component healthy?” is too vague. “Is the dependency latency increasing while our timeout and retry rate are consuming the pool?” is actionable.
Architecture trade-off
There is no free pattern. Every abstraction adds cost in code, runtime, testing or operations. I prefer the simplest design that preserves the boundary we actually need. I add a network boundary, global store, queue, worker pool, cache or micro-frontend only when the reason can be stated in operational terms.
That is also why I avoid architecture by trend. A framework can make a pattern easy to implement, but it cannot decide whether the pattern is appropriate for the business workflow or team structure.
Production checklist
- Use Micrometer for consistent service metrics.
- Propagate OpenTelemetry traces through HTTP and Kafka.
- Add structured trace IDs to logs.
- Bound metric cardinality.
- Track JVM, GC, connection pools and thread pools as saturation signals.
- Alert on error and latency impact, not one transient infrastructure spike.
- Failure behavior is documented and tested.
- Metrics and logs prove the important assumptions in production.
- Rollback or recovery path is known before release.
Related guides
- Start with the Java & Spring Boot architecture pillar
- Related production guide
- Related production guide
Closing perspective
My rule is simple: choose the technology after the boundary and failure model are understood. A production system is successful when another team member can explain why the design exists, how it fails, how it recovers and how we know it is healthy. That is the standard I use for Java & Spring Boot architecture as well.
Your feedback helps prioritize deeper technical content.

Romharshan Singh
Senior Solution Architect and Full Stack Technology Leader with 20+ years of enterprise engineering experience across AI, cloud, distributed systems, Java, Node.js, React, Angular, Kafka and Kubernetes.